
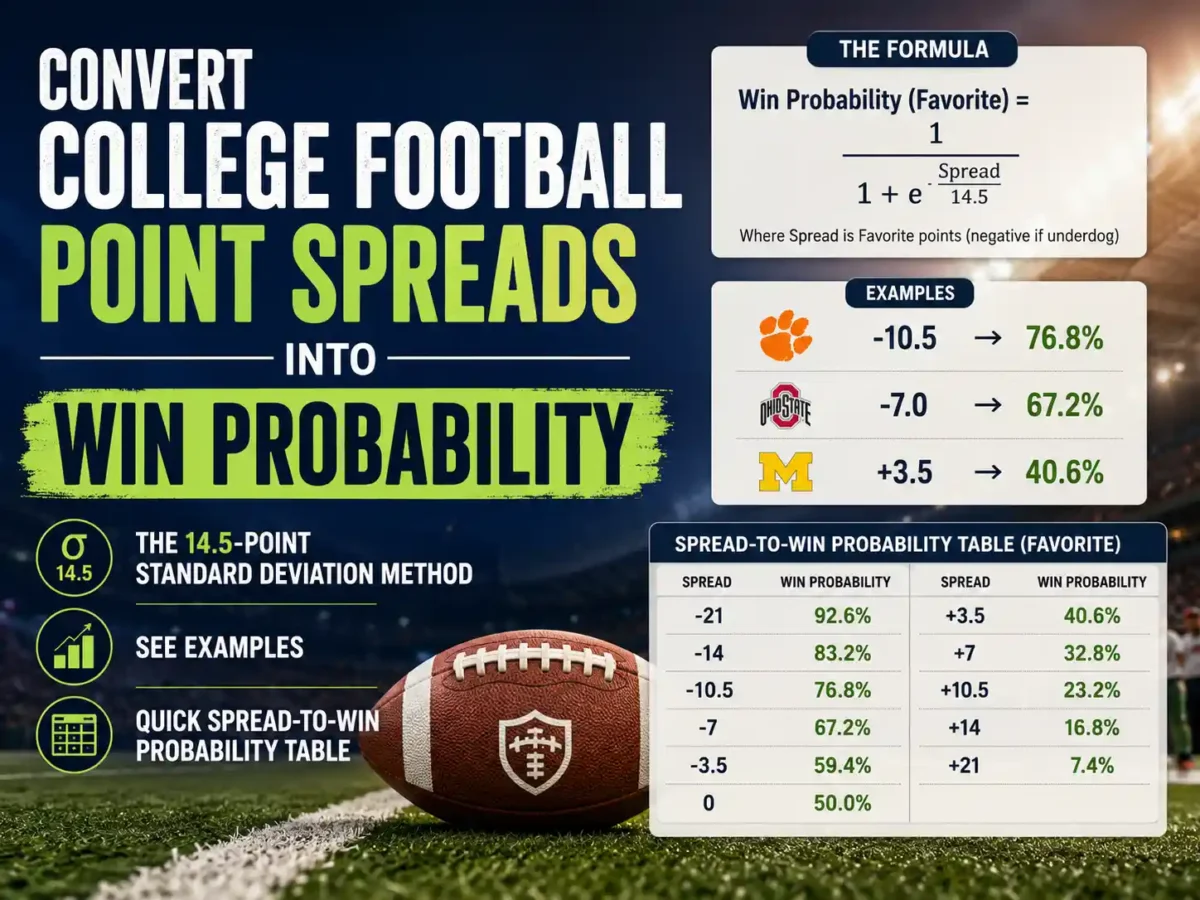



Anyone betting on college football eventually runs into the same question: how do you turn a point spread into an actual win probability?
A spread tells you how many points a team is expected to win by. A win probability tells you how often that team is expected to win the game outright. Serious bettors use this conversion constantly when comparing sportsbooks, checking moneylines, or building their own betting models.
If you searched for the formula to convert point spread to win probability college football, here is the standard method most bettors and analysts use.
How do you convert a college football spread to win probability?
The most common approach uses a normal distribution model based on historical scoring margins in college football.
The formula looks like this:
Use the formula
P(win)=Φ(Spread/14.5)
P(win)=Φ(Spread/14.5).
For example, a team favored by -7.5
-7.5 has an estimated win probability of roughly 70%, assuming a 14.5-point standard deviation in scoring margins.
P(win)=Φ(Spread14.5)P(\text{win}) = \Phi\left(\frac{Spread}{14.5}\right)P(win)=Φ(14.5Spread)
Here is what each part means:
- P(win) = the probability that the team wins outright
- Φ = cumulative normal distribution function
- Spread = sportsbook point spread
- 14.5 = estimated standard deviation for college football scoring margins
Favorites use positive expected margin in the formula, while underdogs produce lower than 50% win probabilities.
Most college football models use a standard deviation somewhere between 14 and 16 points, but 14.5 is the number many bettors stick with for quick calculations.
Example: Converting a -7.5 Spread
Let’s say a team is favored by 7.5 points.
The formula becomes:
P(win)=Φ(7.514.5)P(\text{win}) = \Phi\left(\frac{7.5}{14.5}\right)P(win)=Φ(14.57.5)
That produces a win probability close to 70%.
In practical terms, a college football team favored by -7.5 wins the game outright around seven times out of ten based on historical results.
Quick College Football Spread Conversion Table
Here are rough implied win probabilities for common NCAA football spreads.
| Spread | Win Probability |
| -3 | 58% |
| -5 | 64% |
| -7 | 69% |
| -10 | 75% |
| -14 | 83% |
| -17 | 88% |
| -21 | 92% |
These numbers are estimates, not guarantees. Real probabilities change depending on injuries, pace, weather, and matchup quality.
Why Key Numbers Matter
If you want to understand how to convert point spread to win probability college football, you also need to understand key numbers.
In college football, certain final score margins happen far more often than others because of touchdown and field goal scoring patterns.
The most important numbers are:
- 3
- 7
- 10
- 14
That is why sportsbooks move aggressively around those spreads.
For example:
- A spread moving from -6.5 to -7 matters a lot
- A move from -7 to -7.5 also changes win probability noticeably
Those half-point differences become important when betting large volumes or comparing books.
Why Bettors Convert Spreads Into Win Probability
Most casual bettors only look at the spread itself. Sharper bettors usually care more about the implied probability behind the number.
This helps when:
- Comparing spreads to moneylines
- Finding bad sportsbook pricing
- Building prediction models
- Estimating fair betting odds
- Tracking betting value over time
A bettor may find that a sportsbook’s moneyline implies a lower probability than the spread does. That difference can create betting value.
Spread vs Moneyline
A point spread predicts margin of victory. A moneyline predicts outright win chance.
The two are connected, but sportsbooks do not always price them perfectly together.
That is why many experienced bettors first convert the spread into a projected win percentage before deciding whether the moneyline offers value.
Advanced Betting Models
More advanced college football models add extra variables instead of relying only on the spread.
Some of those include:
- Offensive efficiency
- Tempo
- Home-field advantage
- Injuries
- Weather conditions
- Conference scoring trends
Some professional bettors also use logistic regression instead of the normal distribution model.
Still, the standard spread conversion formula remains the starting point for most betting analysis.
Interactive Calculator Concept
A useful tool for readers would be a simple college football spread calculator.
The user could:
Enter:
- Point spread
- Favorite or underdog
- Custom scoring deviation
The calculator would show:
- Implied win probability
- Estimated fair moneyline
- Historical comparison percentages
Example:
Input:
- Favorite -7.5
Output:
- Win Probability: 69.8%
- Estimated Fair Moneyline: -231
This kind of calculator is especially useful for bettors comparing odds across multiple sportsbooks.
Final Thoughts
Betting on college football with knowledge of the technique to convert point spread to win probability helps bettors comprehend what the sportsbooks are really projecting.
Converting spreads to percentages rather than considering them as random integers facilitates risk evaluation, odds comparison, and betting value identification.
A 14.5-point standard deviation provides a solid baseline estimate for the implied win probability in most NCAA football betting circumstances.
About The Author